
You can spend six or seven hundred thousand euros a year on security tooling and still have no idea whether it does what you bought it for.
That is not an exaggeration. It is what happens when an organisation buys good technology, has it installed by capable people, and then never measures what actually happens underneath.
The licences are paid. The consoles are green. And somewhere between the purchase order and daily operations, a large part of the capability you paid for sits unused or misconfigured.
For every other capital investment, we ask about return. We want to know what the machine produces, what the software saves, what the building yields. For security, apparently, we are allowed to hope.
This piece is about closing that gap: how you find out what your stack is genuinely doing, and what it takes to move the number.
Buying, installing and using are three different things
Most security conversations stop after step two. The firewall is in place. Endpoint protection is rolled out. Microsoft 365 has the right licence tier. On paper, the organisation is covered.
What nobody checks is step three. Are all those capabilities actually switched on for the use cases this organisation runs? Are they configured the way the vendor intended, or the way someone configured them during a rushed migration two years ago?
The honest answer is usually uncomfortable. Someone can tell you their next generation firewall is properly configured. Whether it is standing wide open for your specific traffic is a different question, and almost nobody asks it.
"Buying, installing and using are three different things."
The gap does not stay constant either. Troubleshooting sessions change settings to get something working again. Projects add new technology. Exceptions get created during an incident and never removed. Maturity drifts downwards, quietly, without anyone deciding that it should.
What a best practice validation actually measures
A best practice validation asks a narrower question than a vulnerability scan: given this technology and given these licences, are the available capabilities being used, and are they being used correctly?
That second half matters more than it sounds. Plenty of organisations pay for a licence tier they only partially deploy. The capability is there, it is invoiced monthly, and nobody turned it on. A validation that ignores licences misses the cheapest improvement available to you.
Cyfora scores each technology component separately: firewall, endpoint, Microsoft 365. Each check gets a maturity score and a direction. Green up, flat is stable, red down. That direction is what turns a score into something you can manage. A single percentage tells you where you stand today.
The policy says MFA. The measurement says half.
Take one concrete example from the platform. The check is multi-factor authentication for accounts with administrative roles. The measurement said fifty percent compliant, and fifty percent not.
That number on its own would be irritating rather than useful. What makes it actionable is what sits underneath it: a detailed report listing which accounts fall on which side. Not a percentage, a list.
With that list, the conversation with your operations team changes shape. Are those fifty percent an expected exception for use cases this organisation genuinely has? Or did configuration drift happen somewhere and nobody noticed?
"A score without the underlying report is an opinion with a number on it."
The history view answers the follow-up question. In this case the check sat at one hundred percent when the platform was first connected. Somewhere in April it dropped to fifty. Nobody reported it. Without continuous validation, that gap surfaces at the next annual or biannual health check, which means months of exposure you did not know about.
A maturity increase of +30% without buying anything.
The most useful number in the demo is not a weakness. It is a trend line.
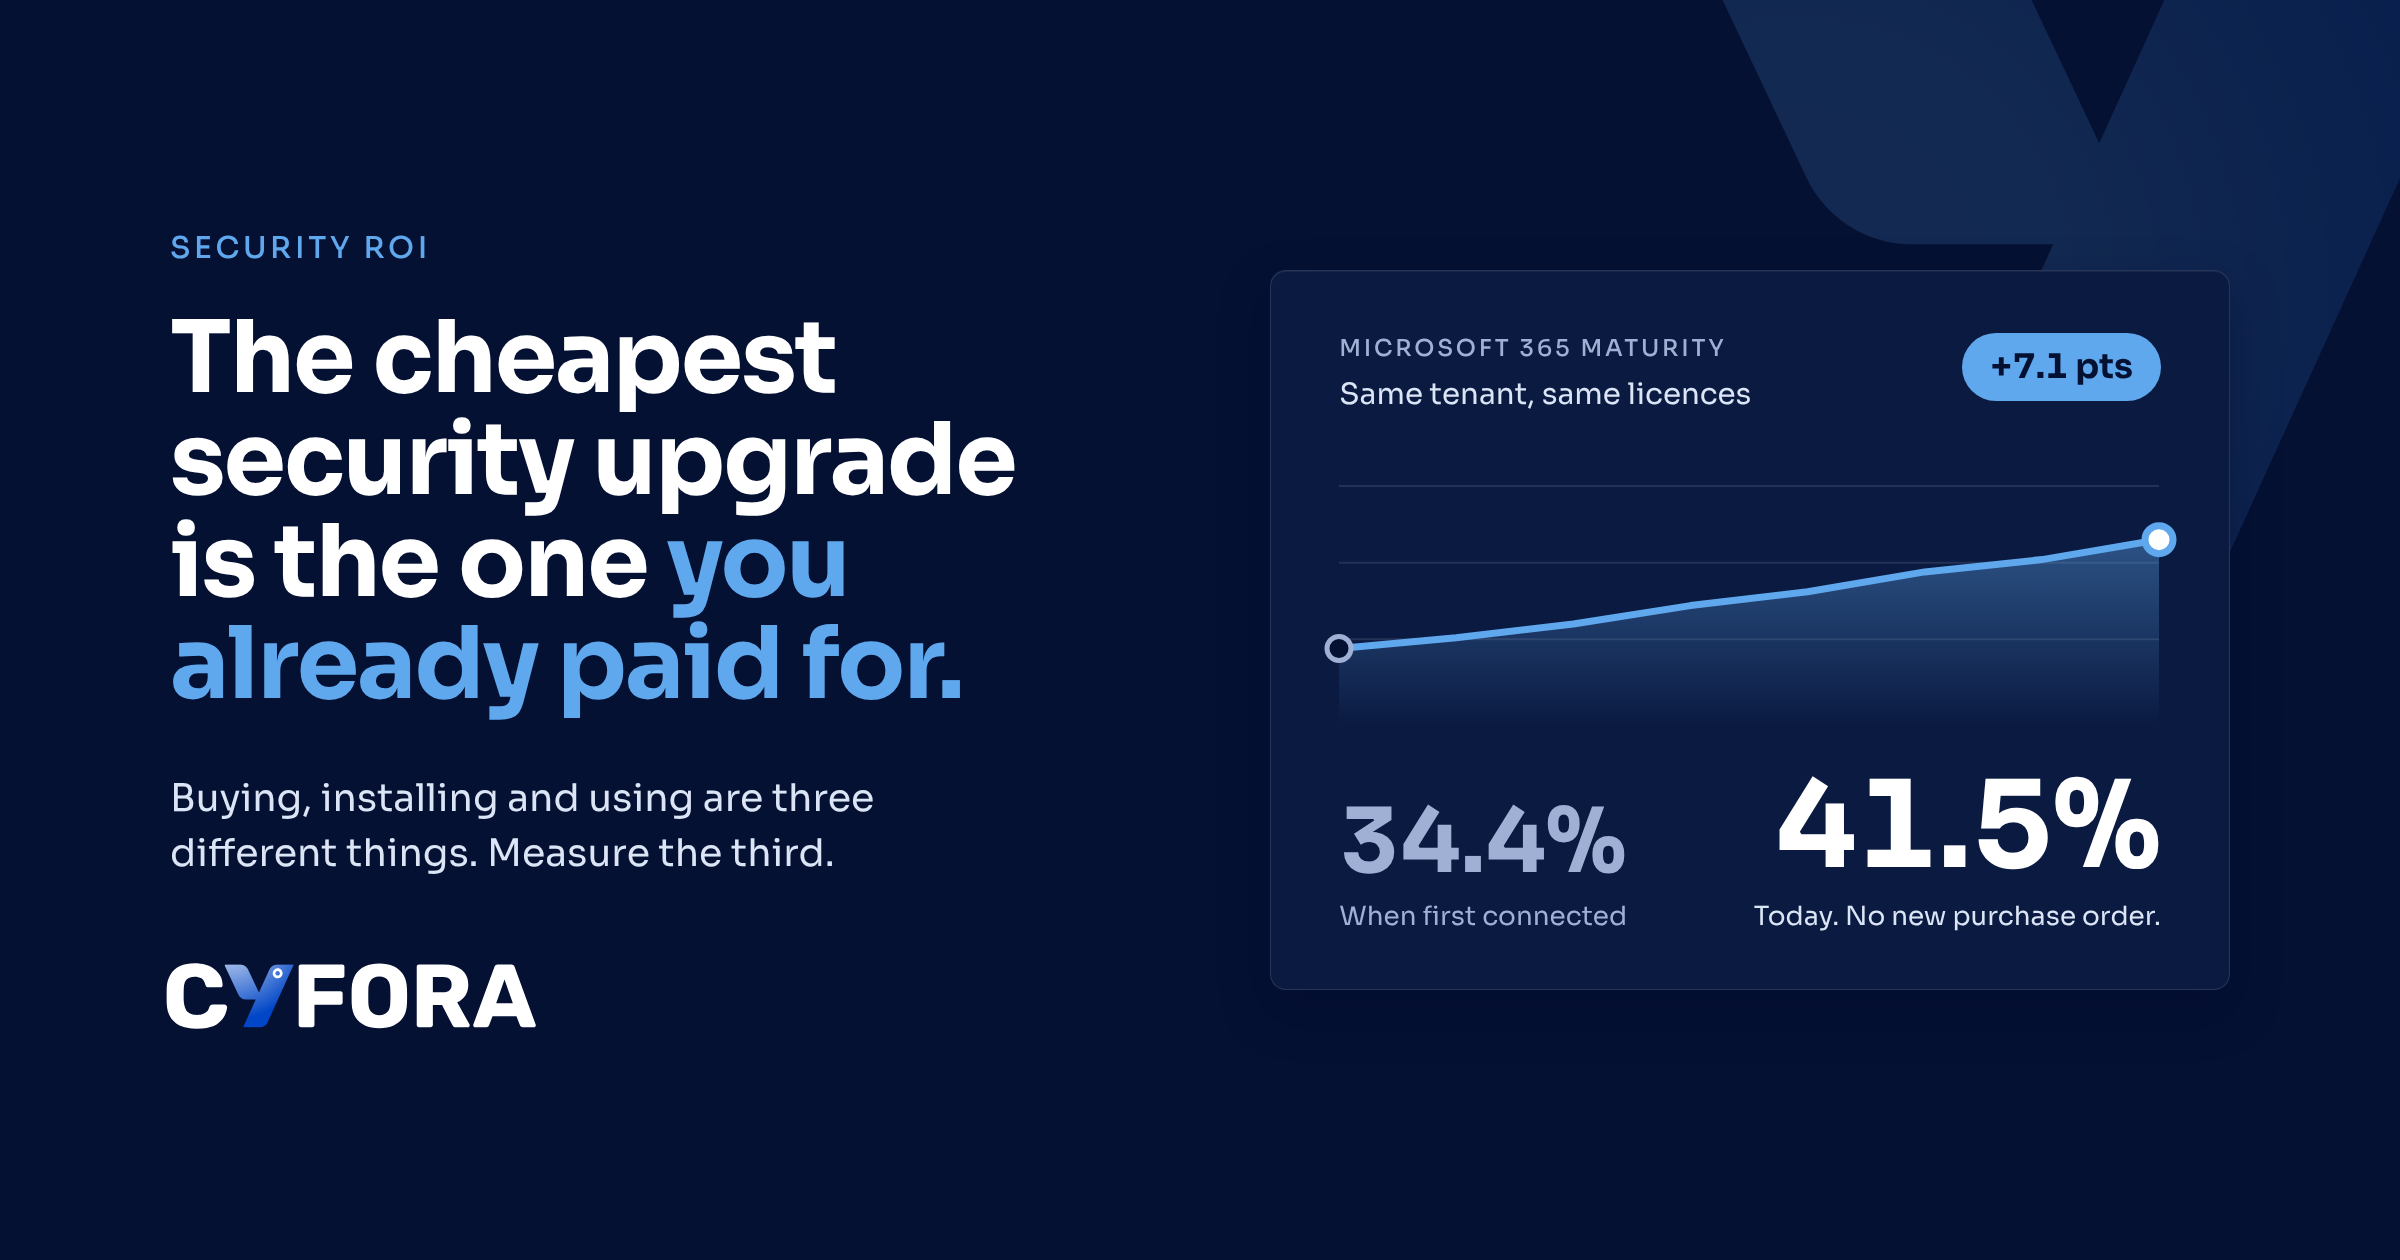
When Microsoft 365 was first connected, overall maturity across that stack measured 34.4%. Today it sits at 41.5%.
Same licences. Same tools. No new purchase order. The difference came from connecting the platform, seeing which capabilities were unused or misconfigured, and fixing them.
That is what return on a security investment looks like when you can actually measure it. Seven percentage points is not a marketing number, it is the part of your existing contract that was sitting idle.
For a board conversation, this is the shift that matters. You stop presenting a security budget as a cost that has to be defended annually and start presenting it as an asset with a utilisation rate. Most organisations discover their utilisation is lower than they assumed, which is uncomfortable for a quarter and useful for years afterwards.
What you can do on Monday morning
You do not need a platform to start this conversation. You need three answers.
Which capabilities are you paying for and not using? Ask your team to compare the licence tier you buy against the features actually deployed. The delta is your cheapest available improvement.
When was each control last verified, not last configured? Configuration is a moment. Verification is a habit. If the last answer is "during the implementation project", you have a gap.
For your three most critical controls, can someone produce the underlying report? Not the score. The list of what is and is not compliant, dated today.
If those answers come back quickly and with evidence, your security investment is probably working. If they come back as estimates, you have found your starting point.
From technical risk to a number you can defend
Compliance is not the same thing as security, and a maturity score is not the same thing as proof. Both distinctions come down to the same underlying question: can you show what your technology is genuinely doing, or are you reporting what you assume it does?
Cyfora exists to close that gap. We connect read only to the stack you already run, benchmark it against best practices and frameworks including NIS2 via CyFun, the Belgian interpretation of the directive, plus ISO 27001 and CIS, and give you the report behind every score. No new tooling to manage. No assumptions to defend in front of your board.
The first step is knowing where you stand. Book a thirty minute demo and we will show you what your own numbers look like.
